
Ask two models how many piano tuners work in Shanghai and the arithmetic can look equally orderly while the answers diverge sharply. In this case study, GPT-5.6 Sol arrived at about 400 people, while GPT-5.6 Terra estimated roughly 800–1,000 people, with 900 as its central answer.
Disclosure: I work with OrcaRouter and used it to run this evaluation. It made switching between models easier while exposing live usage and provider-rate costs.
AI-generated illustration featuring official model logos; logos and model names are used descriptively and remain the property of their respective owners.
Compare the models in this article through OrcaRouter’s model catalog.
The gap was not a simple calculation error. Sol assumed 4% of households owned an acoustic piano, that 80% of those were maintained, and that a full-time tuner could complete 690 tunings a year. Terra assumed 3% household ownership, added institutional instruments and extra service work, then used a lower capacity of 400 jobs per technician per year. Both also made separate adjustments for part-time work.
That is the central lesson from a small test of eight models on two deliberately incomplete estimation questions: the decisive work often happens before the multiplication starts.
What this test did — and did not — measure
The selected runs contained 16 API calls: eight models each answered two prompts, one asking for an estimate of Shanghai convenience stores and the other for an estimate of piano tuners working in Shanghai. Each question-model cell has a sample size of one.
The models were GPT-5.6 Sol, GPT-5.6 Terra, GPT-5.6 Luna, Claude Opus 4.8, Claude Fable 5, Grok 4.5, Gemini 3.5 Flash, and GLM-5.2. Web search was neither requested nor effective in the selected calls.
So this is not a leaderboard, a census of factual accuracy, or proof of stable model behavior. It is a close reading of 16 individual answers. Estimates depend on prompt interpretation and assumptions as much as arithmetic. And two selected prompts cannot estimate calibration or general quantitative ability.
Convenience stores: the definition moves the answer
On the convenience-store prompt, every model began near a population base of roughly 25 million, but they did not count the same thing.
Claude Opus 4.8 separated chain stores from small independent or mom-and-pop shops, giving roughly 8,000–10,000 chain convenience stores but suggesting a much higher total if small independents were included. Claude Fable 5 similarly placed its main estimate around 7,000, while saying the number could double if informal independent corner shops counted.
Other models built the definition directly into a city map. Gemini 3.5 Flash split Shanghai into core urban, suburban, and rural/outer zones, applying one store per 1,500 people in the core and one per 6,000 in the outer area. It reached approximately 11,000 stores. GLM-5.2 used a two-zone split and estimated 11,000–12,000 stores, explicitly including branded chains and modern independent stores but not every tiny traditional shop.
GPT-5.6 Terra took another route: a baseline of one store per 3,000 residents, then a 10–15% uplift for commuters, offices, transit and tourism. Its rounded result was about 9,000. GPT-5.6 Sol split the population between dense urban and outer districts, then ran a consumer-spending cross-check, arriving at about 7,500 with a 5,500–9,000 range.
The observed point estimates therefore ranged from roughly 7,000 to 11,000–12,000, depending on the model and its definition. That spread should not be read as an accuracy ranking: the prompt did not establish a single official category to count. It instead shows a practical habit worth demanding from any model: state what is inside and outside the category before treating the answer as a number.
Piano tuners: assumptions compound
The piano-tuner answers exposed a more consequential distinction: are we estimating jobs, full-time-equivalent capacity, or individual people who earn some income from tuning?
| Reasoning style observed | Example of the key move | Resulting estimate in that call |
| Demand-and-capacity chain | Estimate pianos, annual tunings, then tunings per worker | GPT-5.6 Sol: about 400 people |
| FTE first, people second | Calculate 700 full-time-equivalent jobs, then adjust for part-time work | GPT-5.6 Terra: roughly 800–1,000 people |
| Simpler household-to-workload model | Use 5% piano ownership, annual tuning, and 750 tunings per worker | Claude Opus 4.8: roughly 600 |
| Low ownership, higher average tuning rate | Assume 2% household ownership and 1.2 tunings per piano per year | GLM-5.2: about 350–360 FTE |
The ingredients varied widely. Claude Fable 5 assumed 5% of households owned a piano but only 0.5 tunings per piano per year, producing roughly 300 tuners. GPT-5.6 Luna assumed 2.5% of households had an actively used piano, added 30,000 institutional pianos, and reached approximately 500 full-time-equivalent tuners, with a 400–700 active-tuner range.
The models were not merely choosing different inputs; some were answering subtly different questions. Terra made the distinction explicit by reporting both 700 full-time-equivalent positions and roughly 900 individual people doing paid tuning. Sol also converted an estimated 320 full-time equivalents into about 400 people. A reader who cares about employment, service availability, or the size of a profession should ask which of those quantities is actually wanted.
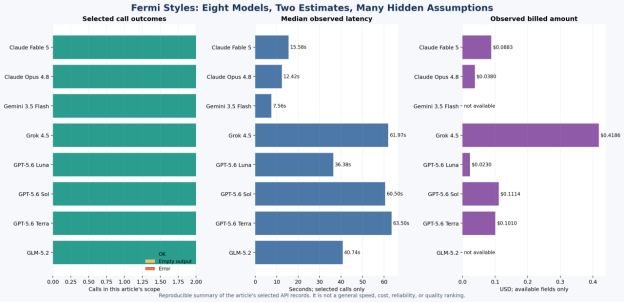
Reproducible data figure from this article’s selected API records; it is not a general ranking.
Detail is not the same as certainty
Several responses used cross-checks: population density against geography, or a piano-stock estimate against a student-based route. Cross-checks can be useful because they reveal whether one set of assumptions clashes with another. But they do not independently verify the result when the new route introduces more unverified assumptions.
This matters especially when models phrase their inputs confidently. In these calls, no web search was used. A claimed benchmark, industry figure, or local detail inside an answer is therefore part of that model’s unsupported reasoning in this exercise, not evidence collected by the test.
More elaboration can also obscure the real uncertainty. A model may show flawless division after choosing a piano ownership rate, a store density, a tuning frequency, or a commuter adjustment. Yet changing any one of those assumptions can move the final answer substantially. The most useful responses made those levers visible and offered ranges or sensitivity cases.
Practical takeaways
For a rough estimate, the best reader-facing prompt is not simply “show your work.” Ask the model to:
- define the category being counted;
- list the two or three assumptions that most affect the answer;
- distinguish people from full-time-equivalent jobs where relevant;
- provide a range and show what would push the estimate toward either end; and
- label any factual anchor it cannot verify.
The number is often less revealing than the assumptions that made it possible. In this small set of answers, models shared familiar arithmetic structures but differed in what they treated as the real object of estimation: chains versus neighborhood shops, maintained versus owned pianos, and workers versus equivalent full-time capacity.
Limitations
This was a case study of two prompts, 16 selected API calls, and one observed call per question-model cell. It cannot establish model calibration, broad quantitative ability, or a universal reasoning ranking. Vendor effort labels should not be treated as equal compute budgets across providers. Observed latency, cost, token counts, and reliability are descriptive properties of these selected calls, not evidence that one model generally wins.
Finally, these were gateway/API observations under the recorded run conditions, not observations of consumer subscription products. The separate closed-ended academic benchmark described in Humanity’s Last Exam is not an estimate-calibration test, so it does not resolve the questions raised here.

Editorial illustration; it frames estimation styles and is not test evidence.
Explore the Models
Explore the current catalog on OrcaRouter Models.
This evaluation was run through OrcaRouter. The author works with OrcaRouter; model access does not imply affiliation with, endorsement by, or sponsorship from model providers.
Model names and logos are used descriptively. All trademarks belong to their respective owners.
Sources
- Humanity’s Last Exam — Center for AI Safety and Scale AI collaborators; retrieved 2026-07-17.